Digital Images
Basics of digital images, and their representation.
Image representation is a fundamental concept in both digital image processing and computer graphics. The challenge lies in how to represent a continuous scene within the finite constraints of digital systems. Here, we will explore the nuances of image representation and formalize the definition in the context of digital imaging.
Let's Start Broad An image can be conceived as a function that assigns an intensity value to every point in a two-dimensional space. This function encapsulates the essence of an image and can be represented in various forms.
Digital Image Representation

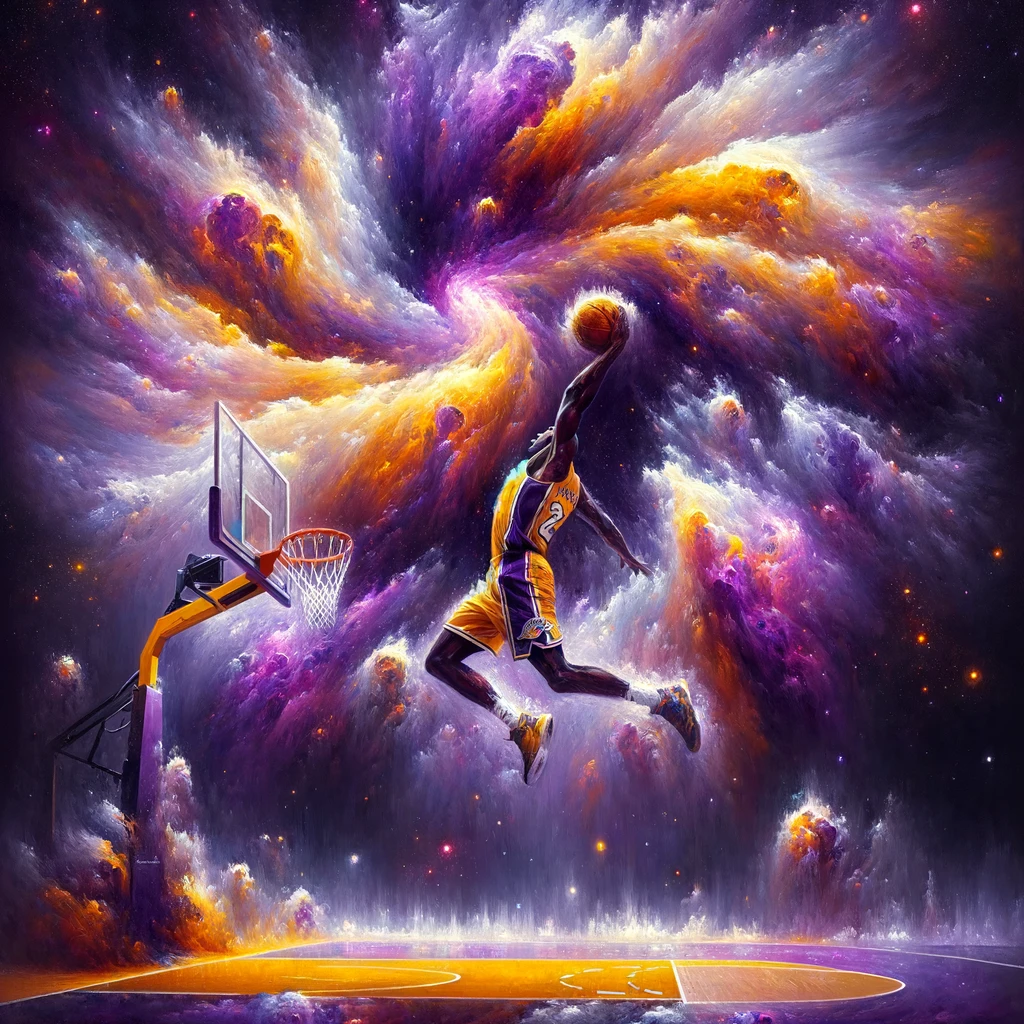
Figure 1: A digital image of a basketball player dunking the ball. The image is represented as a grid of pixels, where each pixel has an associated intensity value. What do you think: is this a raster or vector image?
Diving into Image Representation
-
Explicit Mathematical Representation
- Images can be described explicitly by mathematical equations where the intensity at any point is given by a continuous image function, . This approach is precise but often complex, as it requires an analytical form for the image, which is not always possible or practical for arbitrary images.
-
Implicit Programmatic Representation
- A programmatic approach defines an image implicitly, where a function computes the intensity at every point in the domain. This is versatile and powerful, especially when the image is too complex to be described by a simple equation or when it needs to be manipulated programmatically.
-
Vector Graphics Representation
- Images can also be represented by a composition of geometric shapes like lines, curves, and polygons, each with a mathematical description. This method, known as vector graphics, is resolution-independent and particularly suited for images that comprise distinct shapes and lines.
-
Raster Graphics Representation
- In raster graphics, images are represented as a grid of pixels, where each pixel has an associated intensity value. This is the most common form of image representation in digital systems, as it is well-suited for display and processing on digital devices.
-
Hybrid Representation
- In practice, images are often represented using a combination of the above methods. For instance, a digital image may be stored as a raster graphic but contain vector graphics elements for annotations or overlays.
What do I like using?
I enjoy creating scalable vector graphics (SVG) for my diagrams and illustrations, especially in scientific and technical contexts. SVGs are resolution-independent and can be easily manipulated programmatically. Nobody wants to deal with blurry images, I hate seeing them in presentations and in publications. Even if the text is small in a vector image, you can infinitely zoom in and the text will still be sharp. No excuses.
Formalizing the Definition
To digitize the continuous image function , we perform sampling and quantization. Through sampling, we obtain a digital image with rows and columns. The discrete coordinates, and , are integers ranging from to and to , respectively. The value of the digital image at any point is given by , where the notation is used for specific integer coordinates. This discrete representation constitutes the spatial domain of the image.
Visualization and Interpretation

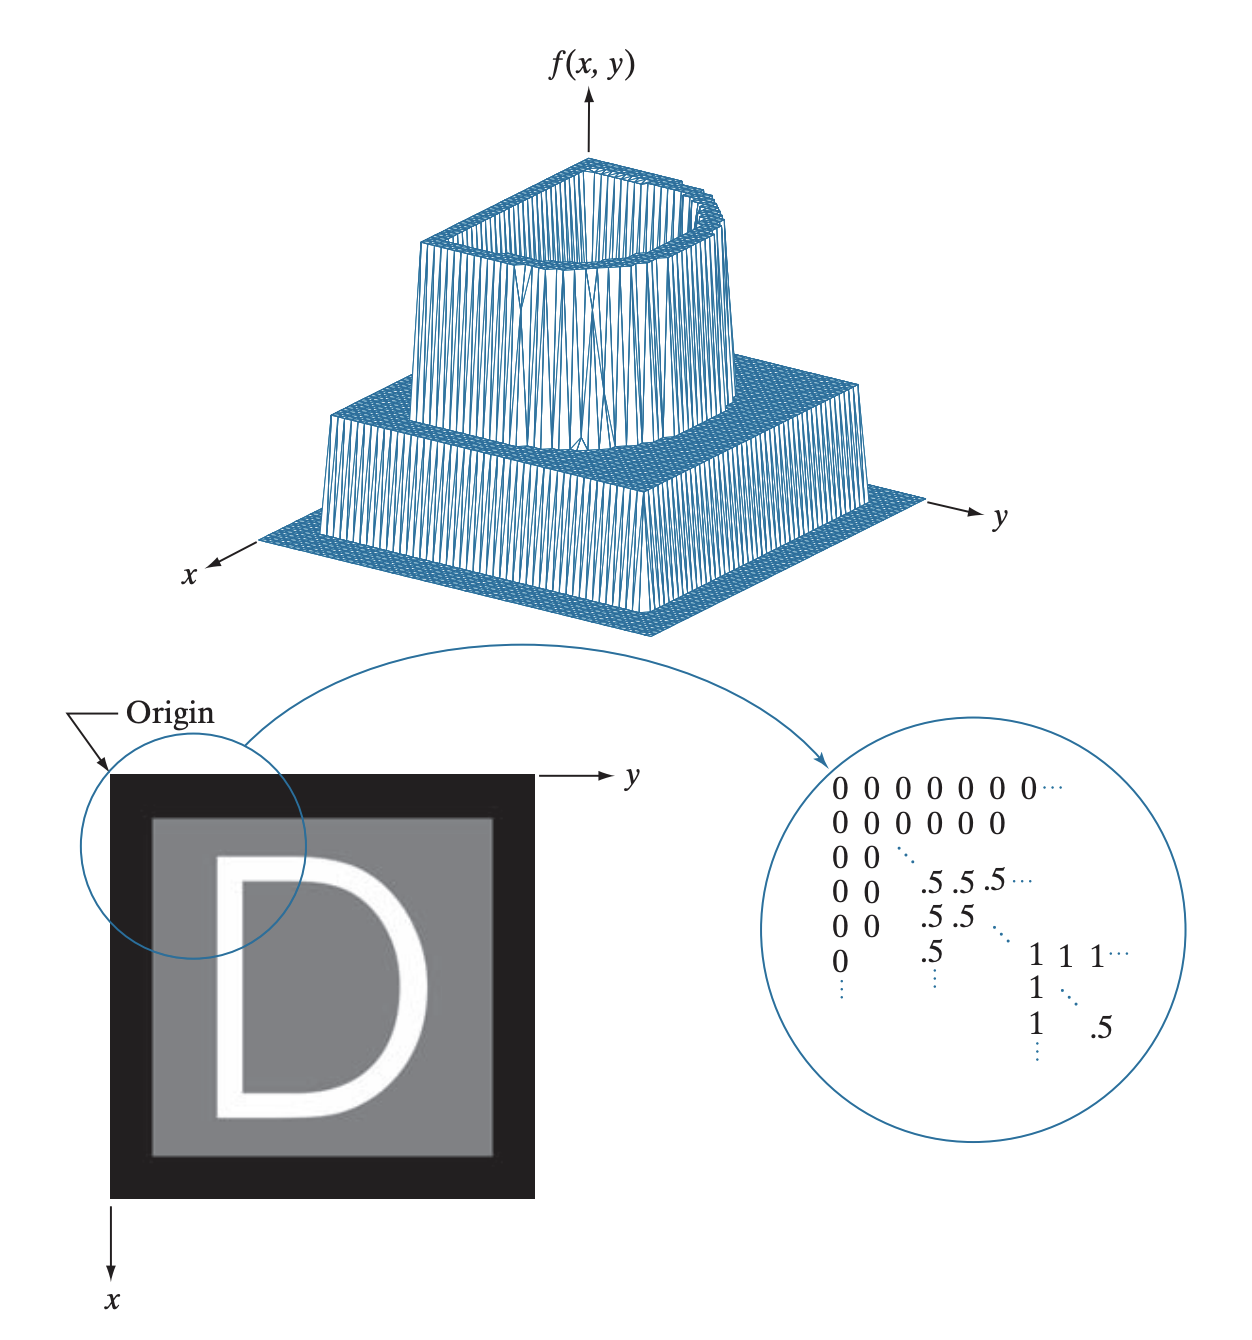
In the textbook1, Figure 2.18 above illustrates three modes of representing :
-
3D Plot Representation
- Figure 2.18(a) depicts a three-dimensional plot where two axes represent spatial coordinates and the third axis represents intensity values. This is akin to a topographical map that shows the intensity at each point as a height in a 3D landscape.
-
Display or Photographic Representation
- In Figure 2.18(b), the image is shown as it would appear on a computer display or photograph. Here, the intensity of each pixel corresponds to the value of at that spatial location. For grayscale images, intensities are typically normalized within the range , translating to black, gray, or white visualizations.
-
Normalized Intensity Representation
- When intensities are normalized, they're scaled to fall within a certain range, typically from black at the lowest intensity to white at the highest, with varying grays in between. This normalized scale is crucial for displaying the image on various devices, ensuring consistency across different mediums.
Image Sampling and Quantization
The rnge of values spanned by the grayscale is called the dynamic range of the image. The dynamic range is the difference between the maximum and minimum intensity values in the image. The upper limit is determined by saturation, while the lower limit is determined by the noise floor. Image contrast is a measure of the dynamic range and is a key factor in the visual quality of an image. The contrast ratio is the ratio of the dynamic range to the noise floor.
Paper: Compositing Digital Images
Thomas Porter and Tom Duff, "Compositing Digital Images," Computer Graphics, 18(3), 253-259, 1984.
I read this paper while I was teaching this class and found it to be surprinsingly relevant to how I make aesthetic plots nowadays.
The paper "Compositing Digital Images" by Thomas Porter and Tom Duff addresses the challenge of how to accurately render images composed of separate elements that may overlap. The problem is to determine the final color for each pixel, considering that elements can be semi-transparent, allowing background elements to show through.
Porter and Duff introduce the concept of alpha to represent the transparency of an image. This leads to the definition of the over operator, which determines how the color from a foreground element should be combined with the color from the background.
They provide mathematical formulas for compositing images using this operator, allowing for the creation of complex images from simpler components by layering them. Their approach accounts for varying levels of opacity and transparency in the composite image. Simple yet powerful, right?
Main Takeaway The paper presents a method to pre-multiply the color by the alpha value, simplifying the arithmetic of the 'over' operator and improving the efficiency of the image compositing process.
This approach has become a foundational technique in digital image compositing, widely used in image processing and computer graphics. I think this is a cool and easy to read paper that you can quickly grasp in a limited amount of time.
Quiz
-
What is the primary difference between raster and vector images?
- Raster images are composed of a grid of pixels, while vector images are composed of geometric shapes.
-
What is the primary advantage of vector graphics over raster graphics?
- Vector graphics are resolution-independent, meaning they can be scaled to any size without loss of quality.
-
What is the primary disadvantage of raster graphics?
- Raster graphics are resolution-dependent, meaning they can become blurry when scaled to a larger size.
-
The digital representation of an image is obtained through which two processes?
- Sampling and quantization.
-
What is the purpose of the over operator in digital image compositing?
Footnotes
-
Rafael C. Gonzalez and Richard E. Woods, Digital Image Processing, 4th ed. (Pearson, 2018). ↩